Enhancing user experience through interactive inspection
 Author:
 Dea María Léon
User experience (UX) has always been an important focus for scikit-learn.
As we know, UX encompasses many aspects, but here we will focus specifically on
how easy it is for the user to understand scikit-learn models during development,
especially while using tools like jupyter notebooks.
First visualizations
Initial work to allow users to inspect their models interactively began in 2019, when Thomas J. Fan introduced HTML visualizations for estimators. He continued to build on this foundation with additional improvements in subsequent contributions.
Lack of resources to go forward
In June 2023, issue 26595 was opened by Gaël Varoquaux outlining several potential enhancements to the HTML displays. These ideas stemmed from direct interactions with users, which clearly highlighted the need for further work in this area. Unfortunately, due to a lack of resources, the issue remained open for approximately a year and a half.
Wellcome grant awarded to scikit-learn
This was until the end of 2023, when Guillaume Lemaitre applied for a grant with the help of NumFOCUS, that the broader topic of Predictive model evaluation and inspection was formalized. Enhancing user experience through interactive inspection is an essential part of this effort and falls within the scope of the grant.
The grant was awarded to scikit-learnand it is from the Chan Zuckerberg
Initiative (CZI) through its Essential Open-Source Software for Science
(EOSS) program. It is funded by The Wellcome Trust and administered by NumFOCUS.
Thanks to this financial support, work is well underway. And several objectives
from the said issue have already been completed.
See the grant application here.
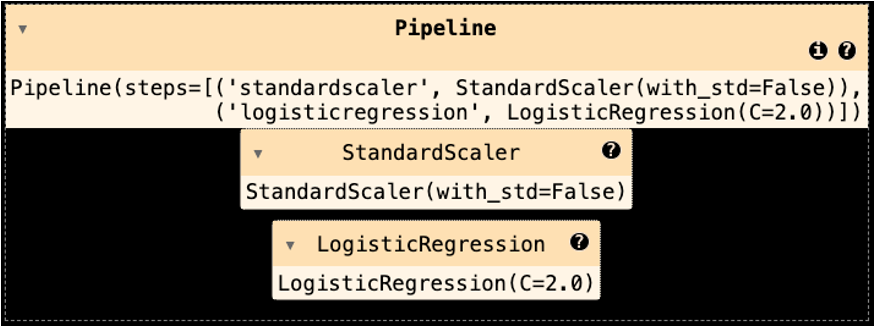
First milestone: Added interactive parameters table for each element
The first milestone was introduced inscikit-learn version 1.7, released in
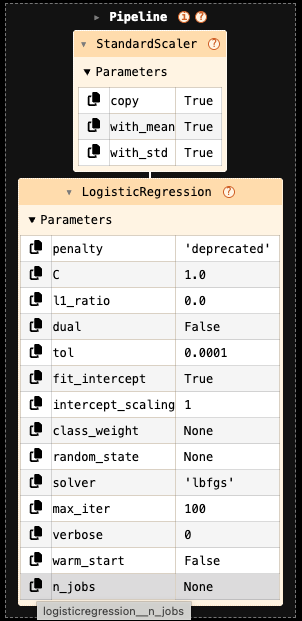
June 2025. A parameters table was added to the HTML representation of models,
displaying parameter names and their corresponding values.
Non-default parameters—those explicitly set by the user—are highlighted.
In addition, a copy-to-clipboard button is available for each parameter name.
The parameter name that is copied to the clipboard is the fully classified name,
which is shown on hover as well. The parameters table is collapsed by default
and can be opened by the user.
The following two images show a pipeline table before and after the milestone.
Second milestone: Links to parameters documentation and tooltip preview
This feature was further enhanced in version 1.8, released in December 2025. We added tooltips that provide documentation for each parameter, as well as links to the online documentation. See the GIF below or this example for more details: Displaying estimators and complex pipelines.
Planned improvements
More features are now being implemented. In particular, users will be able to visualize feature names and values, display fitted attributes and further improve the overall appearance of the interactive displays.